Chart
A chart is a trader’s primary tool that visualizes the price movement of an asset. It allows for market analysis and the identification of price movement patterns.
Our platform offers different types of charts.
Area
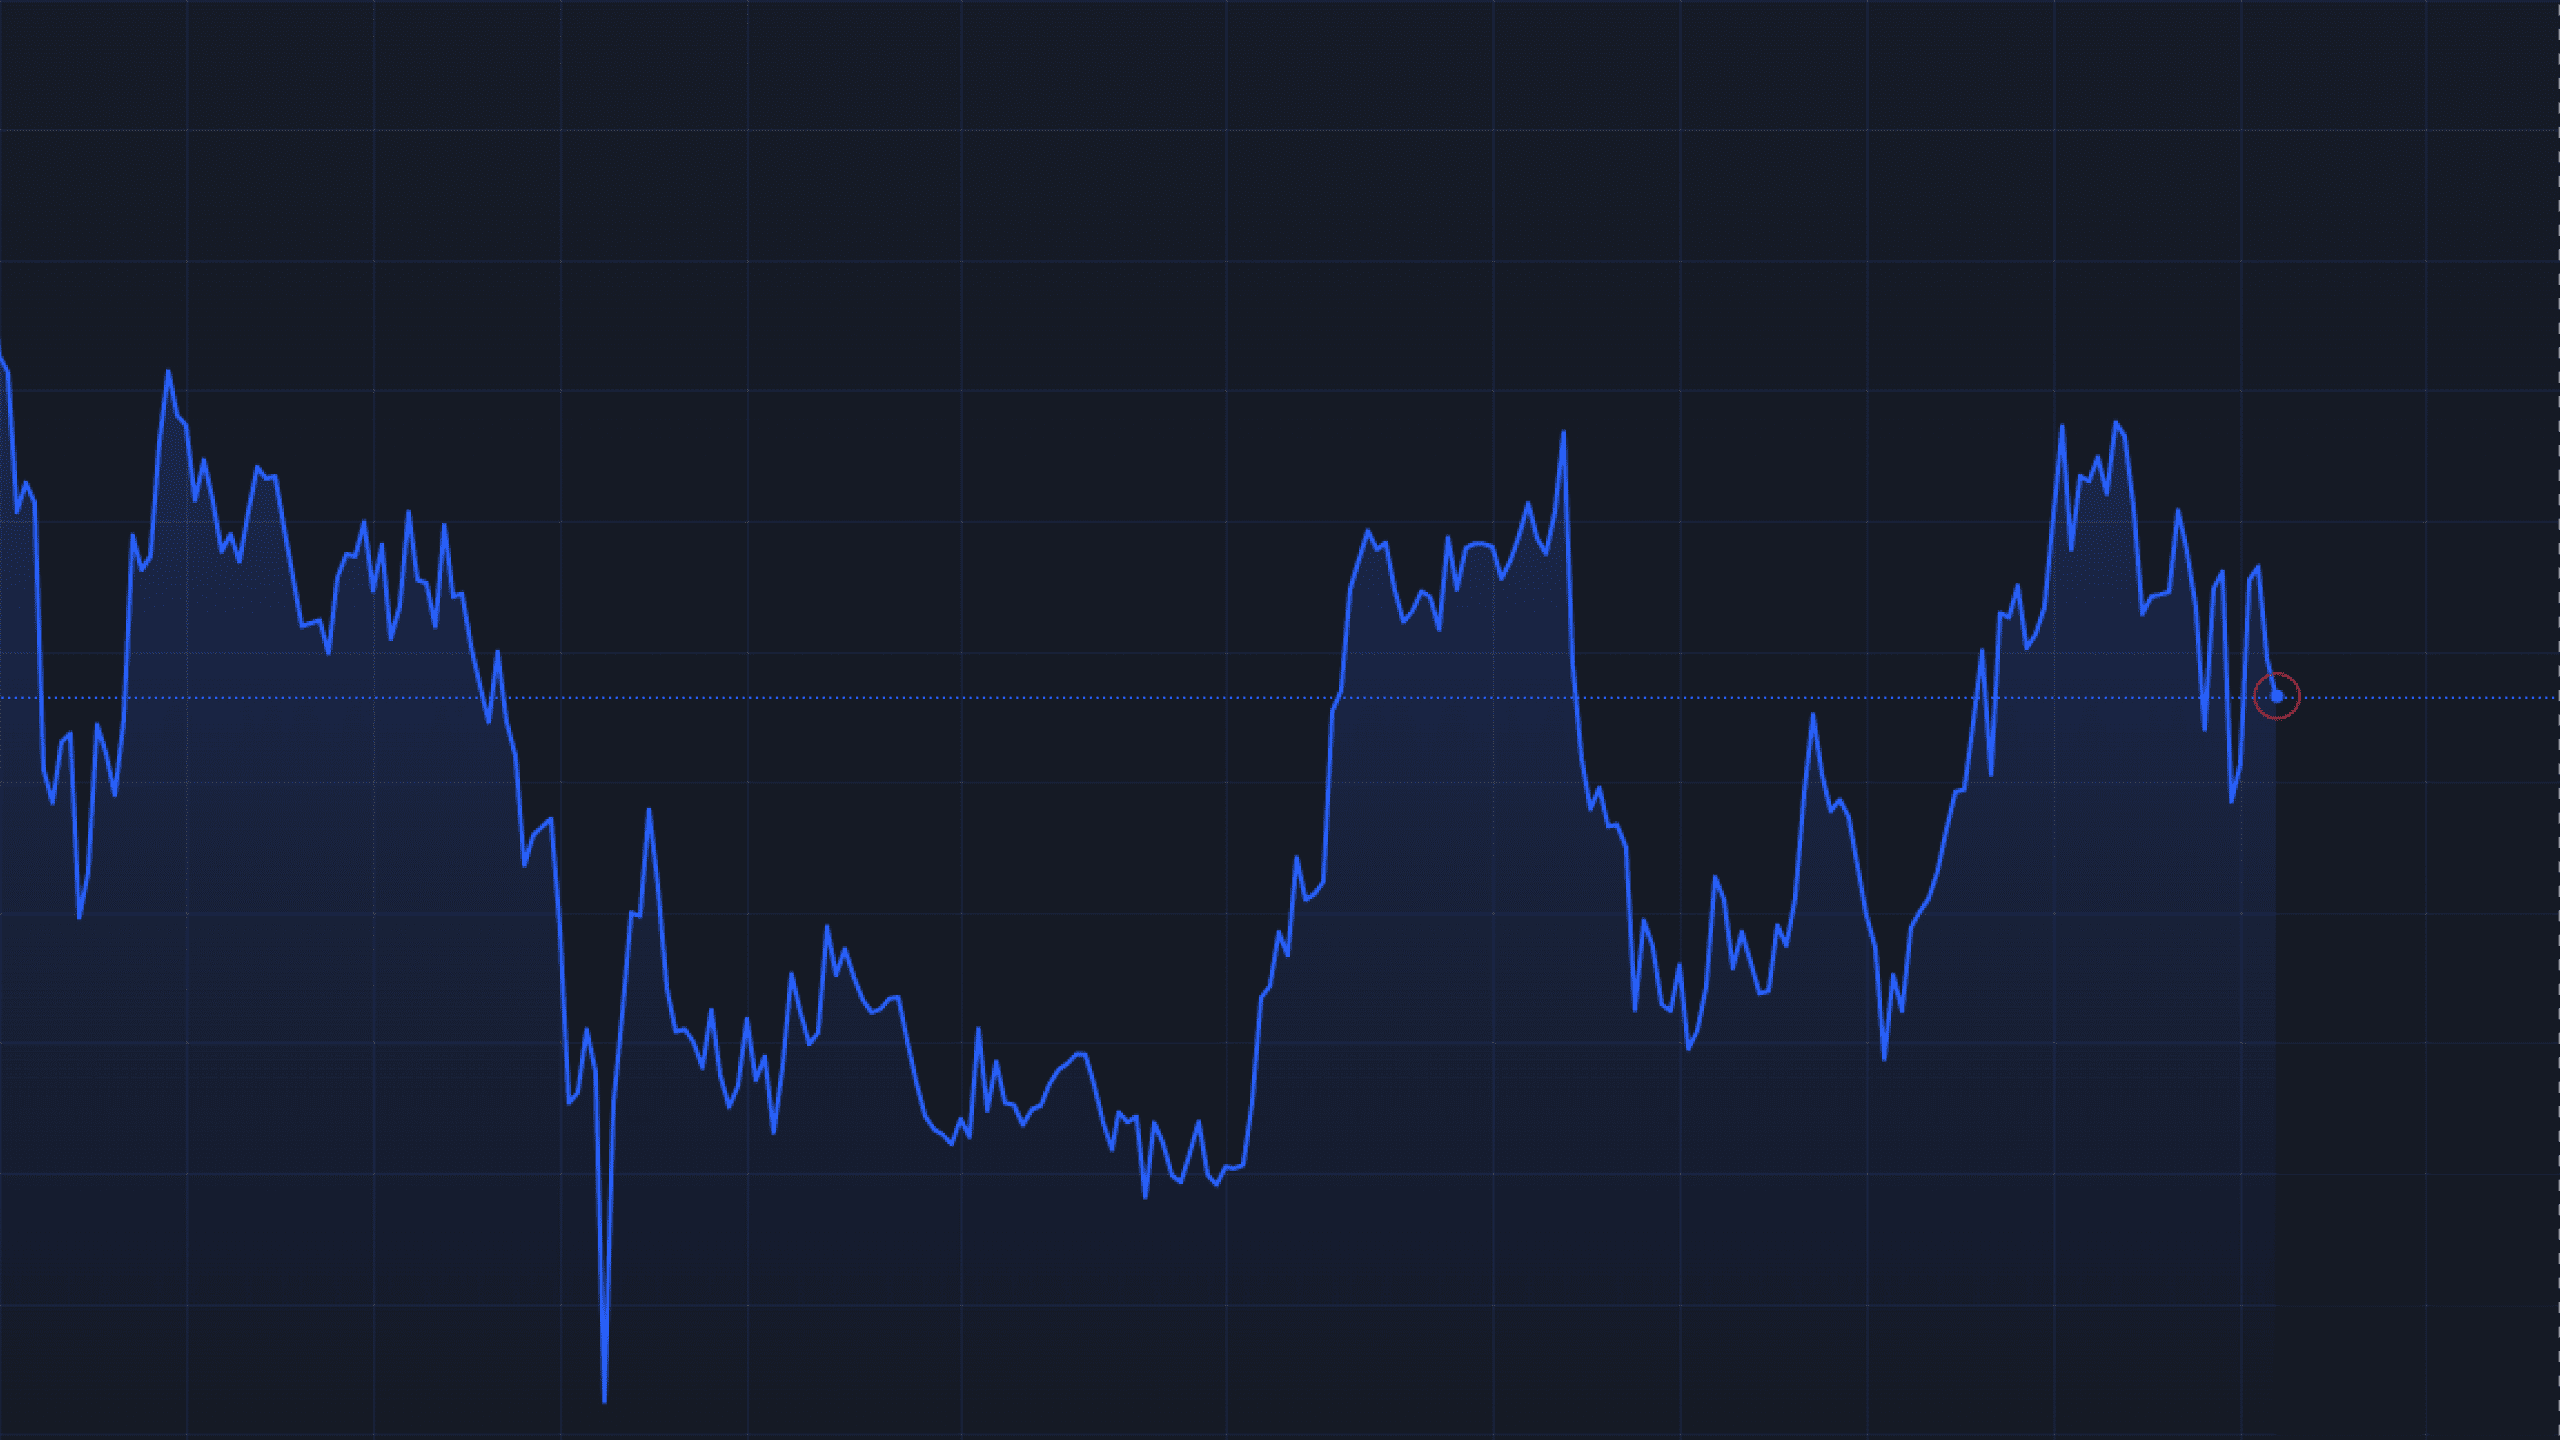
A simple yet sensitive chart that clearly represents price changes. It is useful for quickly identifying trends and reversal points. Visually, it appears as a smooth, continuous zigzag.
Japanese Candlestick
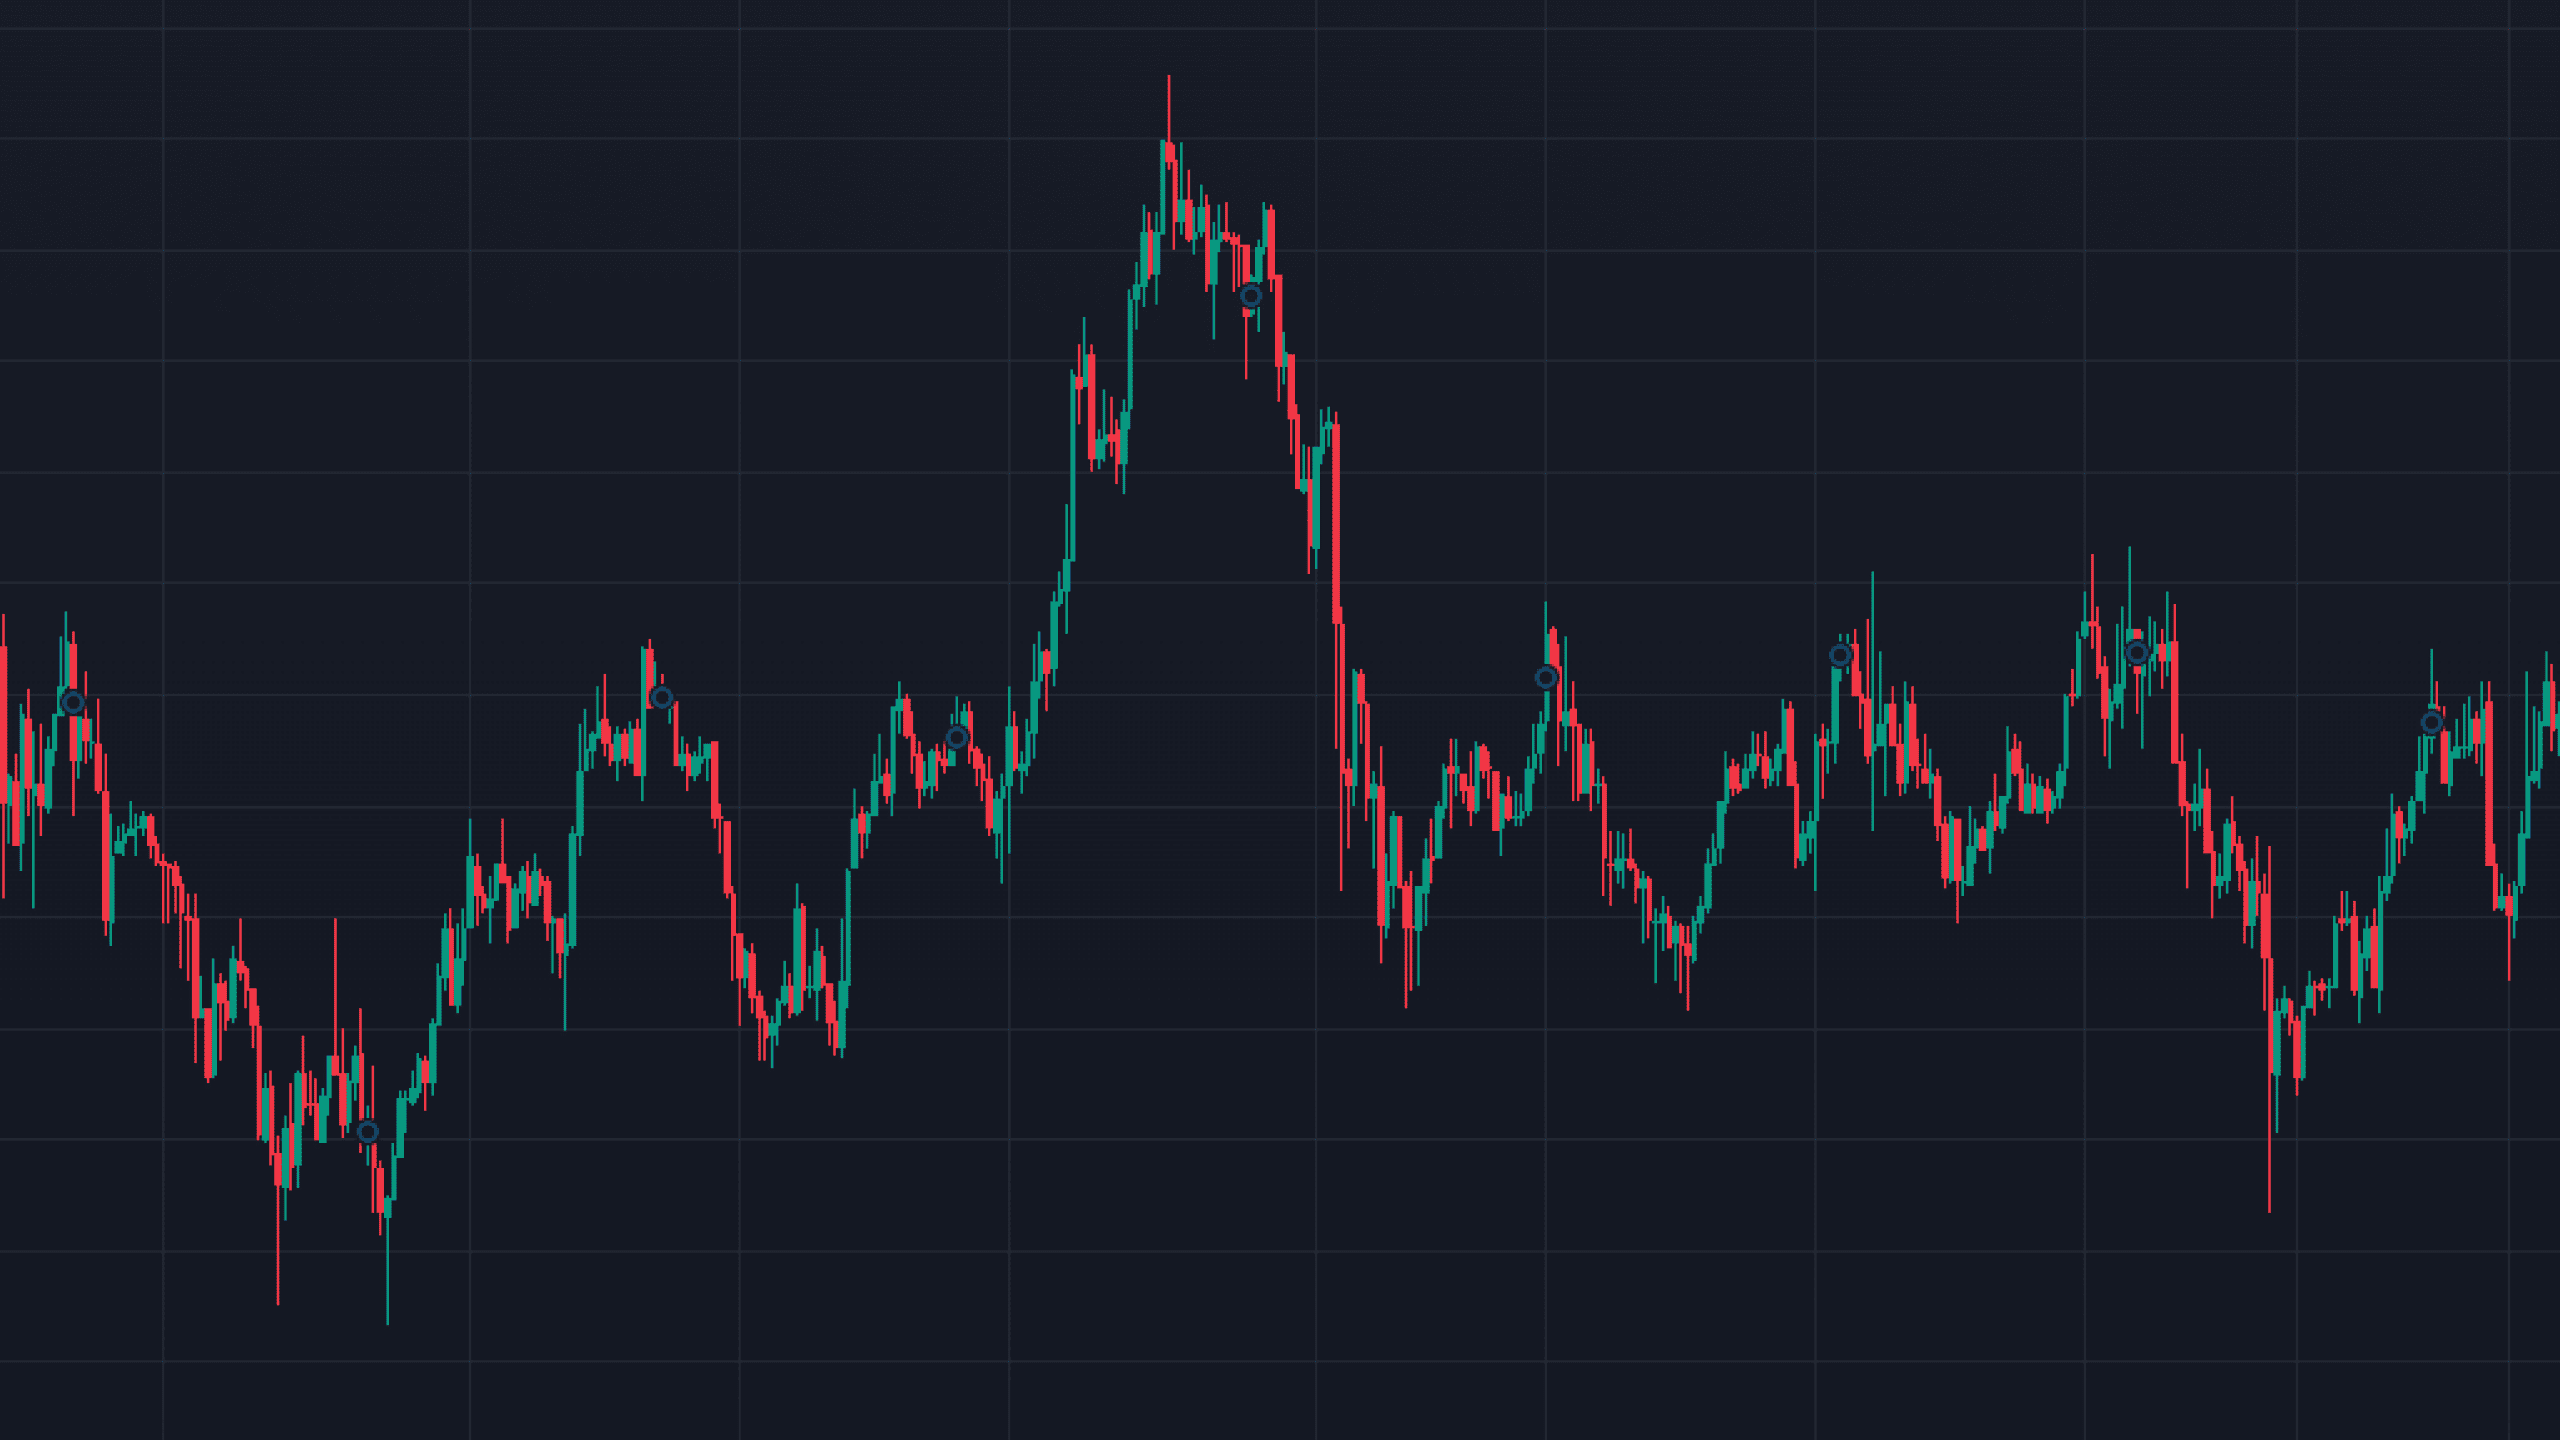
Japanese candlesticks are interval-based charts that display price highs and lows over a specific time period. Unlike a line chart, which only shows the closing price, candlestick charts provide insight into the opening price, closing price, as well as the highest and lowest values within a single candlestick interval.
Last updated on